Tractor Supply Company (TSCO) has been a thing. Here’s the basic timeline:
- 6-06-24 11:45 (mystery time-zone) Robby Starbuck calls for a boycott due to DEI stuff. On X, of course.
- 6-26-24 15:27 Robby Starbuck follows up with a Tweet (are they called an “X”, now?) about their support for open borders.
- 6-27-24 17:22 Robby Starbucks declares victory as Tractor Supply backs down.
Meanwhile, we have headlines such as this one: Tractor Supply LOSES BILLIONS in Stock COLLAPSE As Woke Left Activism EXPOSED. Granted, it’s a Youtube channel, but still.
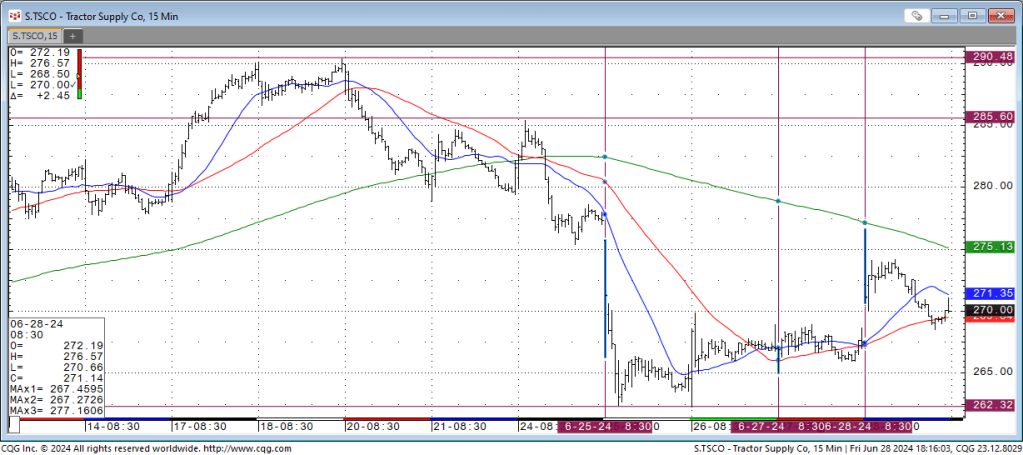
I happen to have access to an excellent market data provider: CQG. The goofy, American date format above is to match the chart labels. The charts are in CDT, so let’s just assume that’s the mystery time-zone from X. The market seems to open at 08:30 and close at 15:00. That means that the latter two Xs are after-close.

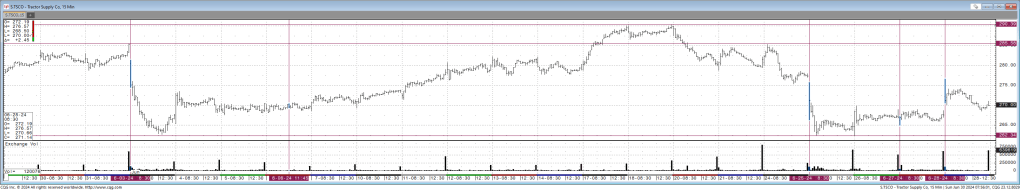
That’s 15-minute bars (very compressed) for May and June. The colored lines are: blue – short period moving average, red – medium period moving average, and green – long period moving average. The horizontal lines are the high (290.48) and low (262.32) – both achieved during June. The vertical lines are points of interest that I will zoom in upon.
The first thing to note is that the high took place during the controversial time. Let’s look at the first drop…
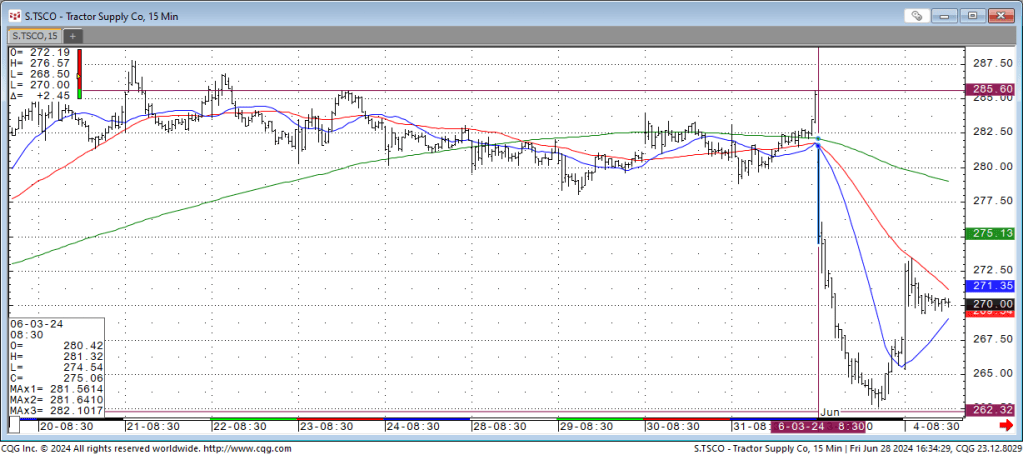
After arguably hitting a resistance price (285.60) on the 2nd, it gaps down on the 08:30 open of the 3rd. It bottoms out (262.66) at 13:00 and closes the day with a small bounce (267.56). It rallies back into the 270 range the next day.
Whatever ended the sideways trend at the end of May and caused that drop on the 3rd of June, it wasn’t Mr. Starbuck. This is before he has said anything. Then he did…

That vertical bar is the time of the X. If anything, it started a rally. The resistance price (285.60) was smashed through on the 18th. The high of the 18th (290.10) was exceeded on the 19th (290.48). What happens next?
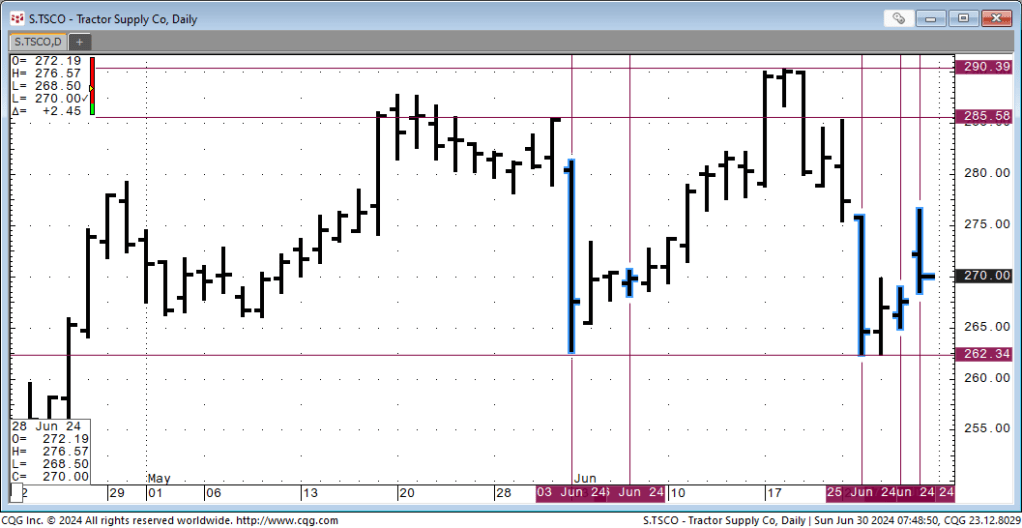
On the 25th, there is a gap-down on open from a 277.37 close to a 275.70 open, with a low of 266.31. It keeps dropping until the bounce off the 262.32 low. It’s possible that it took nine days for Mr. Starbuck’s X to reach sufficient exposure, but assuming causation without more data is a stretch. This is before the open borders X on the 26th, which having been made after market, would have had an effect on the 27th.
There was a slight gap-down, on the 27th open from yesterday’s close of 267.00 to an open of 266.90 and low of 265.00 in the first 15 minutes. It closed the day basically flat at 267.55.
The Tractor Supply response, after market on the 27th, presumably caused the gap-up on today’s (28th) open to 272.19 and a high of 276.57 in the first 15 minutes. It closed the day basically flat at 270.00.
From the beginning to the end of this “saga”, nothing happened. The price at the first X was 270. Today’s close was also 270. There was a low of 262.32 in between.
The Intertubes say, “Tractor Supply has 107,810,394 shares outstanding,” but do not provide a source. That’s hardly as reliable as Edgar, but let’s run with it. To calculate a $2 billion move: $2000M/108M shares = $18.51 per share.
The low (262.32) was hit on the same day as the YouTube video (YouTube does not post the video’s time of upload). Since that low was hit early in the day, that seems a reasonable, albeit generous, price to use as his source. 262.32 + 18.51 = 270.83, which was the high in the second 15 minutes of trading on the 24th. The $2 billion loss didn’t last very long.
At $270, what’s the market capitalization? About $29 billion. $2 billion is about 7%, so non-trivial. Clearly, something happened to cause the CEO’s statement/letter. It seems dubious to attribute it to a significant market move. It seems equally likely that the CEO has a brain and proactively decided “I don’t want to be the next Bud Light.” Well, maybe not equally likely. Vanguard and Blackrock are big shareholders, so he must be under ESG pressure, as well.
I approve of the narrative being played out, here. But that doesn’t mean that I – or anyone – should take headlines at face value. It’s not just big media who lies with every breath they take; even the little guys are looking for eyeballs.
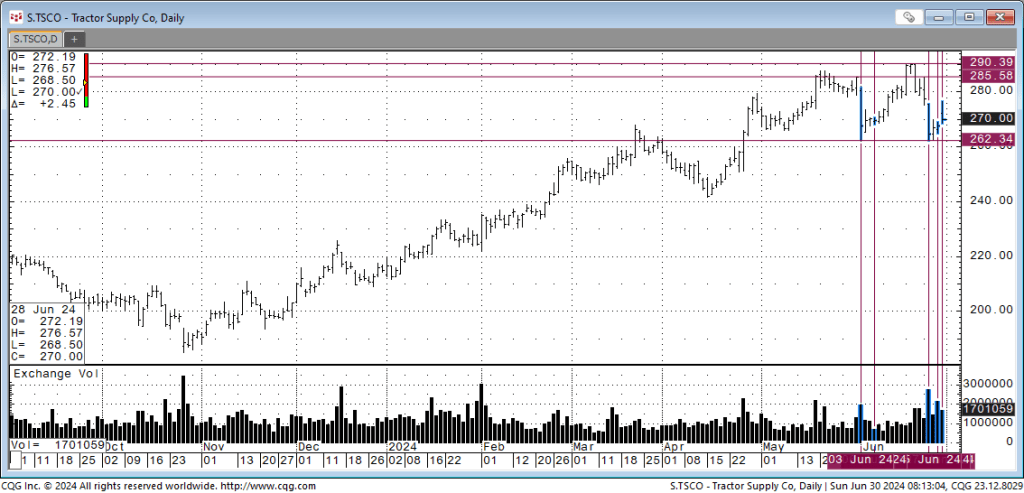
This post was prompted by two comments at Ace of Spades. One saying the narrative was clearly the case – just look at the 1 year chart. Another arguing, “oh yeah? Look at the 5 year chart.” Neither seems relevant to a 20 day X kerfuffle so I thought I’d look, since I can.
A note on market data charting: One can often see what one wishes to see based on bar intervals and time ranges. Humans see patterns, everywhere, even – especially? – where they do not exist. All of the charts above are 15-minute bars. Take a look at the same data in other intervals: